

Overview dashboard
Read knowledge, activity, and operations indicators without mistaking them for fixture data.
The Overview dashboard is calculated from the backend data visible to the signed-in user. It is not a separate content source.
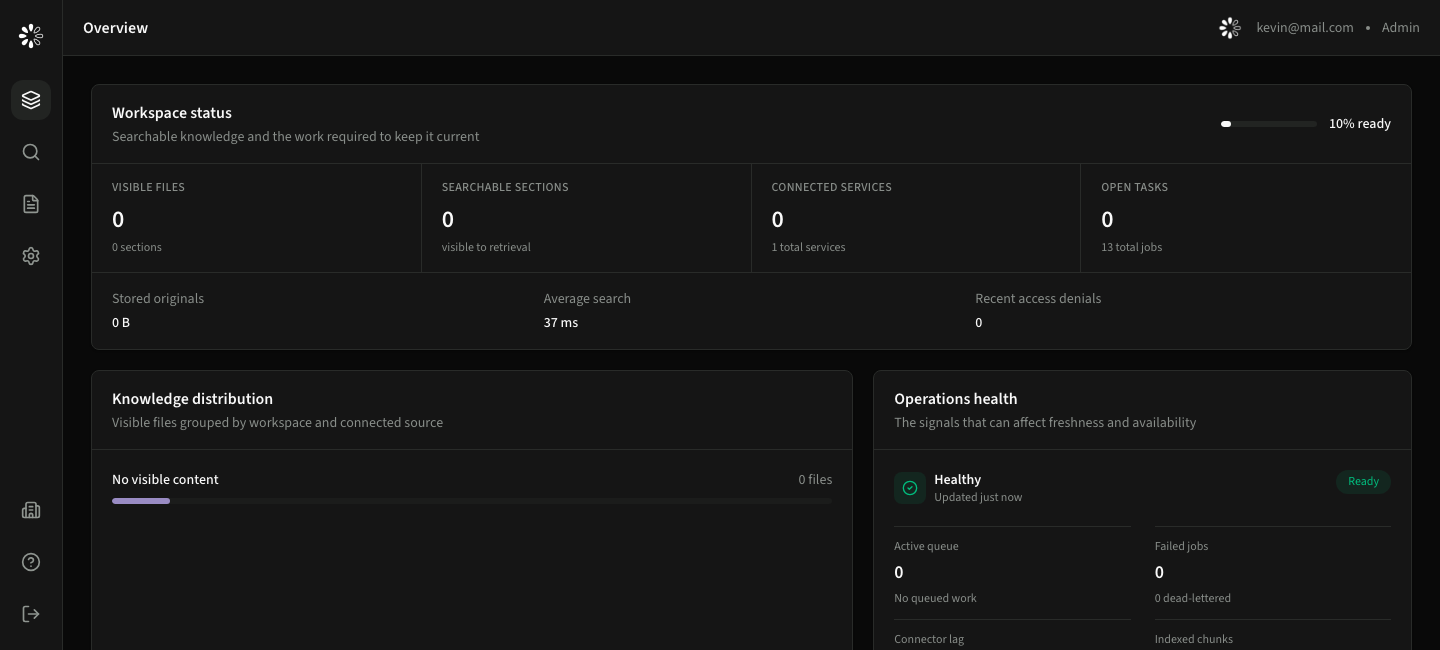
Knowledge summary
The dashboard can show visible files and searchable sections, knowledge grouped by workspace or source, recently updated files, connector freshness, and retrieval readiness indicators.
Counts are permission-aware. Two users can therefore see different totals for the same installation.
Operations health
Operational cards are shown only when your permissions allow access to source management or reports. They summarize queue activity, failed jobs, connector lag, index state, and recent audit coverage.
Use Administration → Diagnostics for the underlying jobs and failed documents. A red state means that an operator should inspect the detailed reason; it does not necessarily mean all search is unavailable.
Interpreting knowledge volume
Knowledge volume groups real documents by their current workspace or connector path. A group with one file is simply a small source grouping, not a demo placeholder. Connector folders and internal workspace folders can appear separately because they have different access and lifecycle rules.